Traffic
The Traffic tab (F2) is the live capture view. Once a forwarder is
running and a client connects, every message that crosses the wire shows up
here.
The three panes
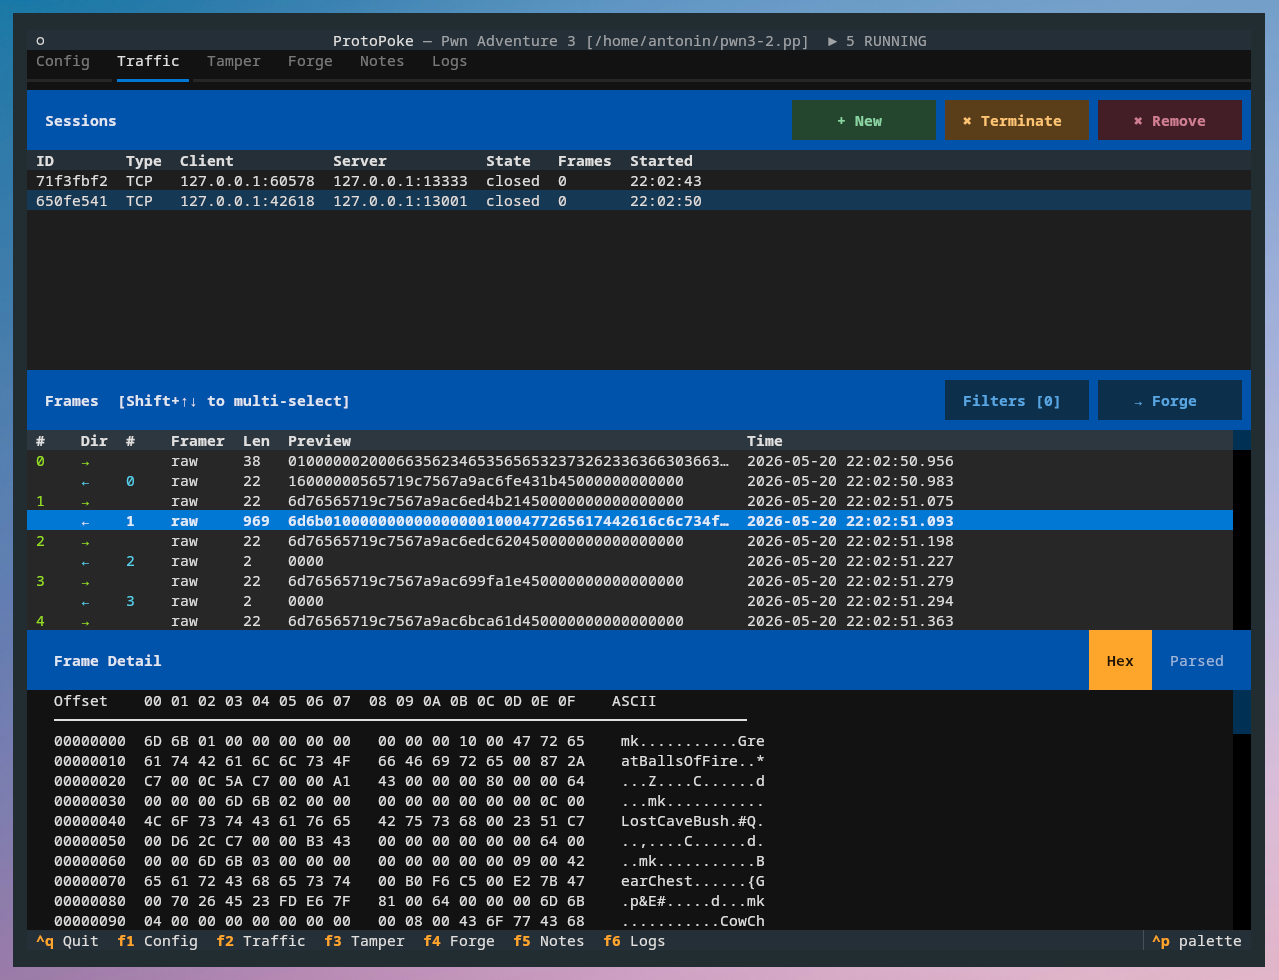
Sessions
The top pane lists every connection — active and closed. Each row shows the session ID, transport type, client address, server address, state, frame count, and start time.
You can also create a session manually with + Create (open a connection to a host/port, optionally over TLS) — useful for poking a server directly without a real client. ✖ Terminate closes a session but keeps it in the list; ✖ Remove deletes it.
Frames
The middle pane shows the frames for the selected session: a client→server
sequence number, the direction arrow (→ / ←), a server→client sequence
number, the framer that produced the frame, its byte length, and a hex
preview.
Select a single frame with the arrow keys or a click. Hold Shift with
Up / Down to extend a multi-frame selection range (Esc cancels it).
Detail
The bottom pane shows the selected frame in full. Toggle between:
- Hex — the raw bytes, with per-field colour highlights when a protocol definition matches.
- Parsed — a Wireshark-style tree of decoded fields (name, value, offset, size).
How traffic is structured
Every byte that arrives goes through two layers before you see it:
-
Framer — TCP is a byte stream with no message boundaries, so the framer cuts the raw stream into discrete frames (one frame = one application message). UDP is already message-oriented, so each datagram is one frame. The framer is chosen per forwarder on the Config tab. Built-in options:
raw,delimiter,length_prefix,line, plus custom scripts. Full reference: Framers. -
Protocol definition (parser) — an optional YAML/JSON file that describes the protocol's message types and field layouts. When one is loaded, frames are decoded into named, typed fields and the detail pane's Parsed view comes alive. Full reference: Protocol Definitions.
A good workflow: start with the raw framer, look at the hex in the detail
pane to spot message boundaries, pick the right framer, then iteratively
build a protocol definition until every field is named.
Display filters
Long-running captures get noisy. The Filters button opens the frame display filter modal, where you build an ordered list of show/hide rules that match on framer name, direction, or payload pattern. Filters can be individually enabled/disabled and reordered — they affect only what the Frames pane displays, not what is captured.
Screenshot placeholder — display filter modal.
Sending a frame to Forge
Select one or more frames (using shift and arrows) and click → Forge to copy them into the Forge tab — either as a new playbook or appended to an existing one. This is the "send from traffic" path: capture something real, then replay or edit it.
Next
- Intercept — hold and rewrite frames live
- Framers / Protocol Definitions
- Core Library — Traffic — the same, via the API